
| Segmentation Analyzer | ||
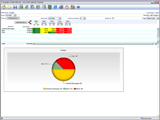
| This module is generally used to do segmentation analysis. It is possible to select several data elements from different business entities (age, location, salary, gender, etc.) and to analyze the impact on KPI (Key performance Indicators) by analyzed segment. |
| |
| Actual versus Budget | ||
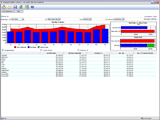
| This module shows, very quickly and easily, different data summaries comparing actual vs. budget, actual vs. previous year data, deviations and target analysis as well as detailed graphics of month-to-month variations. It is a useful instrument for companies with a monthly, quarterly or yearly budget, but also for those companies who track these metrics daily. |
 |
|
| Share and Growth | ||
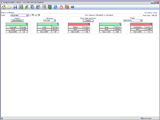
| Simultaneously tracks each category, class, and sub-class, as well as division, region, or market in order to visualize the performance of any Key Performance Indicator (KPI). This module detects immediately the best and worst performing entities of a business. It is easy to identify best and worst branches, products, channels or demographics segments. In addition, this module makes relative-time comparisons so it is possible to detect evolutions and involutions. |
 |
|
| Share and Growth Plus | ||
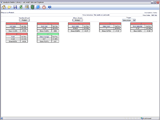
| Track all KPIs (Key Performance Indicators) in a single view and instantly understand period-to-period performance and percent contribution of products, stores, customers, and so on. As an example, this module shows us sales, stocks, costs or gross margin indicators in a very intuitive way. It includes visual alarms that allows us to create comparisons between an individual branch and the rest of them. |
 |
|
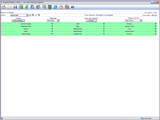
| Color Board | ||
| The Color Board module allows you to monitor the performance of an area of your business on a single screen. Color Board presents you with a graphical representation of exceptions - defined by triggers that you can set and modify. Using this module, you can evaluate the dimension’s members and compare individual contributions against the category or total. |
 |
|
